


Appendix 6 – Statistical Analysis
The interdependence of factors in 5.2.3 is analysed applying formal statistical techniques in this appendix.
As one of the dimensions in the cross-tabulation (objectives for environmental improvement) allows for multiple choices, the single counts in the matrix can not be regarded independent; in example the conditions to apply a standard chi-square test for homogenous distribution are not fulfilled.
Therefore, the focus of this analysis is narrowed down to a hypothesis where p1, p2 and p3 represent the proportions of the respondents for local, national and international businesses having stakeholder satisfaction (SS) as part of their environmental objectives:
H0: p1=p2=p3
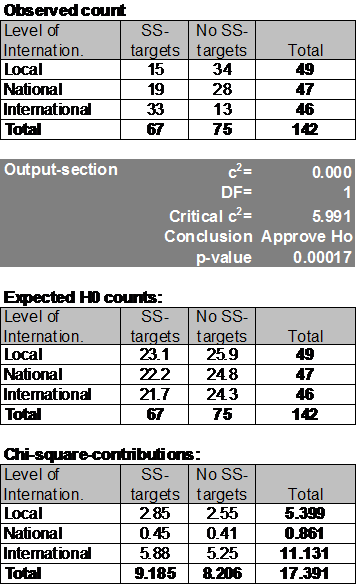
A chi-square test has been applied with a level of significance of 5%.
Chi-square test for Homogeneous distributions
Level of significance: 0.05
Test-i:
International, National and Local
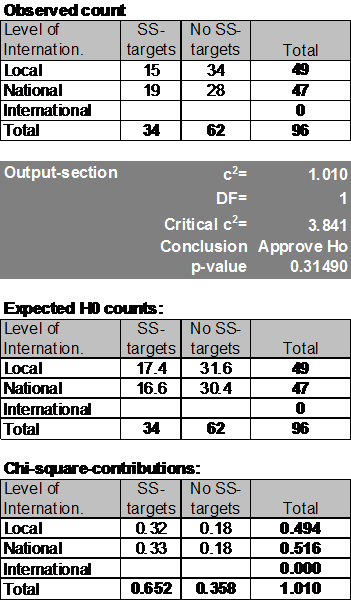
Test-ii:
National and Local
The table above (Test-i) shows that the proportions are significantly different (p-value 0.017%) for any reasonable choice of significance-level.
Comparing only the local and national responses (Test-ii) the difference between those are not significantly different (p-value 31.5%), in example the difference could be random.
Further to quantifying the findings 95% confidence-intervals are created for the proportion of international businesses having stakeholder satisfaction (SS) objectives as well for the anticipated common proportion for national and local respondents.
Confidence interval for population
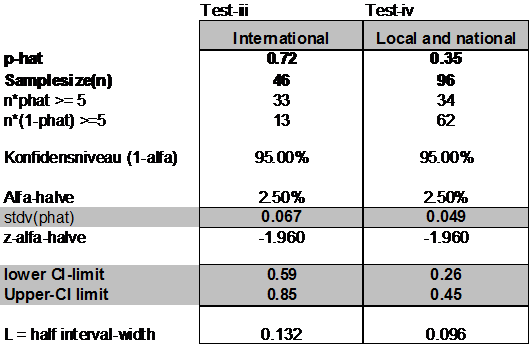
The resulting intervals (59%-85%) and (26%-45%) corresponding with standard deviations for the p-estimates on 6.7% and 4.9% shows that the uncertainty in estimating the proportions are rather big. A bigger sample size could reduce this uncertainty.
Calculations are made in excel based on a template originating from Sid Sytsma, Ferris State University.