


4. Field Research Design
This section describes the chosen research methodology and justifies it based on research literature. Details are provided regarding data collection techniques, how the population is targeted and the instruments used. Challenges in the data collection procedure and how they are overcome is described as well.
Figure 17: Thematic Framework of Research Design
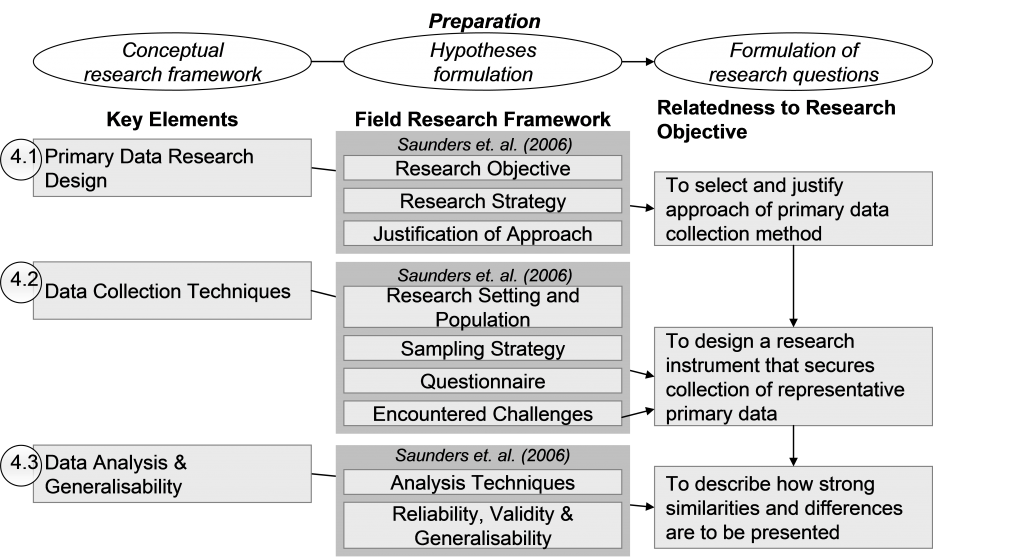
Source: Author’s own creation based on recommendations in Saunders et. al. (2006)
4.1 Overall Field Research Design
The literature review resulted in formulation of a theoretical proposition and two research hypotheses that are to be tested by research questions.
Quantitative primary data answering the research questions is to be gathered by a web-based survey.
4.1.1 Field Research Objective
The research output is to assist in achieving the objective stated in 1.1.2 and to meet the formal requirements determined in 1.1.1.
The chosen hypothetical-deductive research approach (as proposed by Saunders et. al., 2006) is to confirm or reject the hypotheses. This is achieved by collecting primary quantitative data that enables answering the research questions.
Data collection is to be achieved before summer holiday and the peak season in the industry, to ensure that respondents prioritize filling out the questionnaire.
A sampling size of 1,500 with a response rate of minimum 10% is to secure rigour and objectivity to findings.
Legal restrictions concerning sharing personal data (e-mail addresses) must be fully complied with.
Respondent’s privacy and undisputed anonymity regarding sensible questions such as business strategy is to be secured, as well as they are not to feel pressurised to participate. As the researcher is employed in the industry, all reasonable precautions will be taken as proposed by Bryman & Bell (2007, p133).
Respondent’s use of time must be limited to a maximum of 8 minutes.
Collected primary data are to be analysed to provide outputs of similarities and differences that are to be presented and interpreted in section 5 as proposed by Saunders et. al. (2006).
As the CSR topic is of ethical nature, avoidance of any potential discomfort or embarrassment of participants is to be highly prioritised in the data collection, analysis and interpretation.
4.1.2 Research Strategy
To achieve the objective of the field research a quantitative method with primary data gathered by a web-based survey is selected. The rationale behind the selection is the need for identification of industry specific features that can be validated as representative for the industry.
Due to the small industry sample universe respondent’s privacy and undisputed anonymity is to be carefully secured according to the guidelines recommended by the Market Research Society (2006). To fulfil this important objective collection of data is to be secured by a professional research institute, and specific personal responses and details disclosing the identity of respondents are not to be distributed outside the research institute’s data warehouse.
To avoid pressurising participants the level of reminders are to be minimized and respondents must continuously be informed that they are able to leave the survey at any time. The risk of ethical embarrassment of respondents not having any environmental objectives is to be avoided by limiting their questions regarding strategic implementation Bryman & Bell (2007, p127-147).
Respondent’s time consumption is to be minimized by pre-segmentation (based on researcher’s industry knowledge) and intelligent question paths so the respondents only answer in-dept questions where relevant as proposed by Bryman & Bell (2007, p676). Pre-segmentation in the value chain is to remove one question from the survey.
To motivate response a brief conclusion of the analysis will be offered the respondents to enable them to benefit from investing time in answering the questions.
Access to potential respondents is to be based on existing contacts in the industry known to the author, and a contact person in the branch organisation in which the industry businesses are organised.
To fulfil the limitations in the time schedule and legal restrictions in sharing personal e-mail addresses, an innovative strategy utilizing branch relationships in gathering respondent information and directing these directly to the professional research institute is implemented.
4.1.3 Justification of Approach
The questionnaire strategy is seen to be best at closed-ended questions and explanatory research (Saunders et. al., 2007 p356) of cause-and-effect related questions.
Measures of key attitudes and behaviours across a group of individual corporations need to be comparatively easy to explain and understand, and selecting a survey research strategy is seen to be accepted as authoritative by people in general (Saunders et. al., 2007 p138).
A qualitative or combined research method could be used instead of the quantitative. Research based on the qualitative method would benefit from a more in depth analysis of the multiple relationships in CSR threshold levels and filters. The cultural, psychological and behavioural issues in the research could have been better addressed with a qualitative research method (Creswell, 1994).
The research could also have benefited from the more emergent and inductive form of research logic, rather than the pre-identified hypotheses presented in the quantitative research method. The more value-laden nature of the qualitative research could have brought the benefit to the research to uncover and discover patterns or theories of links in the CSR filters that help explain the sense-making process in the industry (Marshall & Rossman, 1980).
The benefit in the quantitative method used in this research is the possibility for an accurate verification of the mathematical and statistical data used in formulating the research information. This allows the reader (receiver) of the research information to follow the deductive form of logic in testing the hypotheses and remain sure that the researcher has not interfered in objectivity of the conclusion.
As the initial literature review has identified the main components influencing the sense-making process in the industry, the research questions are to test the connections and patters in the industry. This type of cross-sectional studies under a tight time schedule is also seen to fit well with employment of a survey strategy (Saunders et. al., 2007 p148).
The quantitative investigation seeks to record what is happening, with the intent to empower the readers to change future events. Therefore, the quantitative research method with a survey strategy is seen to be justified in the field research that secures a direct realism philosophy (Saunders et. al., 2007 p104).
One other major benefit from the chosen design is the apparent match between the deductive quantitative research methodology and the design method used in the industry, starting from abstract architecture that are turned into construction blueprints by mathematical objective engineering capabilities and then rea-lized in concrete buildings in practice.
4.2 Data Collection Techniques
The data needed in the research has not been determined in any other research. A web based questionnaire is to collect a primary data sample in the population.
4.2.1 Research Setting and Population
The population consists of the industry value network described in table 1.
There exists no explicit known and documented population size. To achieve knowledge of how representative the convenience sample is, the population is divided into quotas and compared to the sample (Saunders et. al., 2007 p228).
A total population of approximately 30,000 registered businesses in the construction industry is narrowed down to the approximately 6,500 businesses organised in the branch organisation Danish Construction Association (DCA), of which the sectors representing the entrepreneurial and brick-laying corporations are selected.
This brings the population in the segment professional building industry to a total of 3,561 (DCA 2007, Annual Report). Industrial production of concrete is carried out by 126 corporations and raw-material businesses account for 28.
The total population in the research thus reaches 3,715 businesses. The quotas and targets of sample size and response level are broken down in table 1.
Table 1: Population, Target Sample Size and Target Response Level
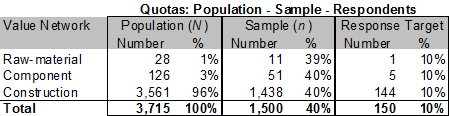
Source: Author’s own creation based on Bryman & Bell (2007)
The quotas sampling fractions (n / N) are satisfactory (1 in 40) but when taking the expected response rates in account, the response rates in the Raw-material and Component quotas must be higher to reduce statistical uncertainty.
4.2.2 Sampling Strategy
The sampling strategy constructed is based on the framework offered by Dillman (2000).
An e-mail is to function as a “cover letter” introducing the respondents to the purpose and benefits of the survey. A link to the survey web-address is to secure easy one-click access. The survey is targeted at the management level.
The primary stakeholder brands are well known to the survey sample, and were used as powerful sponsors and to increase interest in participating in the questionnaire. The possibility to benefit from the research output is intended to increase the desire in filling out the questions.
Based on a practical experience from the analysis company intended “time remaining” information was changed to “questions remaining” to secure respondents filling out the full questionnaire.
The number of reminder mails to be sent is limited to one issued one week after initial contact. The reminder is to increase the rate of response among non respondents. The number is limited to one to avoid pressurising participants.
According to Dillman et al (1998) the response rate is increasing if web-surveys load quickly and this is more important than fancy presentation. This is secured by outsourcing the actual data collection to the professional research institute.
The benefit of receiving information regarding the research results was secured by ticking off a yes field, due to the identified threat of non completion of the survey if asked to fill in an e-mail address.
Sampling is based on convenience where all accessible sources are used to retrieve e-mail addresses that enable initial communication towards the targeted businesses. See 4.2.4 regarding encountered challenges.
4.2.3 Questionnaire
A web-based questionnaire was chosen. The main objective with the questionnaire was to secure rigour data collection that was not interpreted by the researcher. The questionnaire design was based on the literature review and the research questions formulated in part 3.2.
Survey questions are presented in a more logical order than the research questions. The logical order is chosen as well to secure interest in fulfilment of the survey (Dillman, 2000).
A pilot test has been conducted and feedback securing clearly formulated questions has been incorporated. The logic of the question flow was tested as well, and reorganized to secure they appeared in a logical manner to the survey sample.
The pilot test also revealed that if respondents did not have any environmental objectives, they would stop the survey response before reaching the end. The survey was then looped so that if respondents were selecting “No environmental objectives” in question 7 they were looped to the end question 12.
English sample of the final survey is provided in appendix 5.
Questions were first formulated in strategic context terms and then translated to Danish. Stakeholder review and the pilot test feedback secured Danish formulation of questions in more casual and industry specific terms. The questions have been back-translated for the purpose of this assignment, and are compared to the original in table 3 (appendix 4).
The structure of data to be collected is listed in table 4 (appendix 4) based on the research hypotheses and questions formulated in part 3.
4.2.4 Encountered Challenges
The first challenge encountered was a policy of non-disclosure of e-mail addresses within branch organisation. This was encountered by an innovative strategy as described in 4.1.2.
Second challenge was a too low sampling size. If the response level were to be low it would result in data-output that did not achieve a level where statistical analysis was possible. This was countered by hard work on the internet, retrieving e-mail addresses to increase the sample size. However this reduced the ability to secure one respondent from each business. It also influenced determination of respondent’s representativeness according to population quotas, as respondent’s identity is non-disclosed to the researcher.
There were a lot of lessons learned in the pilot questionnaire. People in general had difficulties in understanding the theoretical based questions. As example the word “strategy” can be of both high “generic strategy” business level and functional “how to do” business level. This was encountered by pilot-testing the questions among potential participants and clarifying possible misunderstandings.
Translation from English to Danish and back, and adaptation of a language in the questionnaire that were both common and business like were a challenge. The back-translation technique to achieve language difference comparison was a good practical advice that assisted in the process.
4.3 Data Analysis & Generalisability
The primary data output is either categorical descriptive (nominal) or ranked (ordinal) data.
4.3.1 Analysis Techniques
Comparisons and contrasts, using simple data matrix and pie/bar charts will be presented under each corresponding heading in part 5. Columns, rows and bars are put up in a consistent logical sequence.
Data output is coded according to the relevant question as illustrated in table 6 (appendix 4). The units measured and sources of data will be linked to the research questions by the codes.
Similarities and differences between variables will be highlighted and missing data will be classified and commented at the end of each data presentation.
4.3.2 Reliability, Validity and Generalisability
The selected field research strategy and tactics have been designed to reduce the participant error and bias. However, the reliability in the research interpretation may be subject to the researcher’s personal beliefs and/or lack of experience in the field.
Due to the selected convenience sampling strategy there is a risk that the sample is biased.
That would in particular be the case if easy accessibility of people addressed correlates with particular attitudes or behaviour contained in the questionnaire. Secondly, some of the answers might depend on the knowledge and attitudes of specific persons within a business. Whilst the first point could introduce a systematic bias, the latter should only result in a minor random contribution to uncertainty.
The risk of receiving response from more than one person in each of the businesses exists as well. This bias must be considered when relating results to the part-population in question.
To secure some rigour of collected data the respondents are to be stratified by functional line of work and size of organisation, to allow for some justification of the respondents as being representative.
Due to the non disclosure objective access to primary data will be limited. This will limit the ability to validate by statistical analysis. However, crucial conclusions will be statistically analysed where feasible.
Generalizing the results to the population should be expressed as differences and similarities found in analysis, where relevant taking the above mentioned sample-constraints into consideration.