


5. Field Research Data Output
To achieve the objective of the field research a quantitative method with primary data gathered by a web-based survey was conducted. The statistical differences and similarities found in the data output to confirm or reject the hypotheses. Justification or rejection of the respondents as being representative will be presented.
5.1 Data Output Composition
The overall data composition is presented to determine the validity of the data as being representative for the population.
The objective of >150 respondents was achieved, as a low sample representation in the Construction quota, was compensated by large sample sizes and response rates in other quotas.
Pre-segmentation / Population, Sample & Response
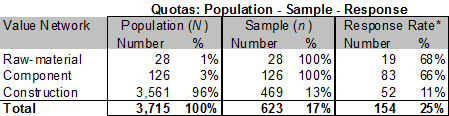
* (number of usable questionnaires / (total sample – unsuitable members))
Non respondents: 0
General Management respondents represent the largest functional area (48%). Industry specific statistics regarding functional spread is not available for comparison. The spread seems to give plausible reason for confidence.
Q13 single choice / sample
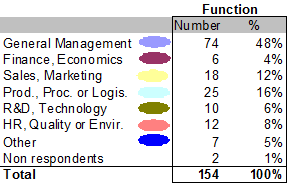
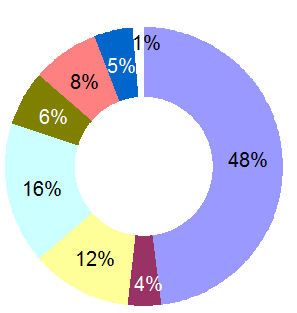
Non Respondents: 2
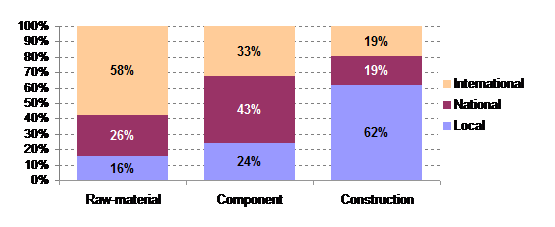
Level of internationalisation varies in the value network, and considering the differences in sample size and response rates the levels are not representative compared to the population.
Pre-segmentation / Q1 single choice
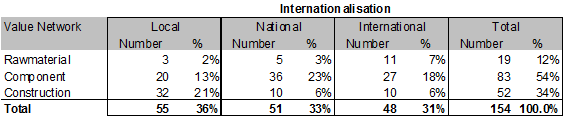
Non respondents: 0
The validity of the data as being representative to the population is questionable due to the risk of bias described in 4.3.2, but will be used to explore the indicative relationships between the interdependent issues.
The data composition related to the research questions and the actual (English version) questions from the questionnaire is presented in table 6 (appendix 4), to enable quick reference to research questions and the answers available to the respondents.
5.2 Strategy Development and Selection
The theoretical proposition resulted in development of a hypothesis that was to be tested by the research questions.
(1) Vision, mission and strategic intent are heavily influenced by the competitive forces and motives in the sense making process.
The quantitative data collected enables an analytical approach to answering the research questions.
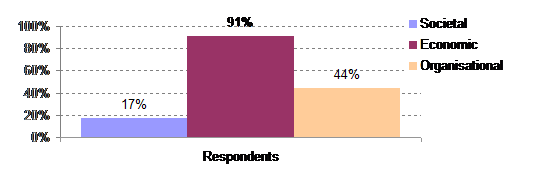
The interdependence between vision/mission and strategic intent was analysed based on the data collected in the questionnaire and illustrated below.
91% of respondents answered that they are addressing customers, suppliers and creditors (economic stakeholders) in their stated vision or mission.
Respondents / Q6 multi choice
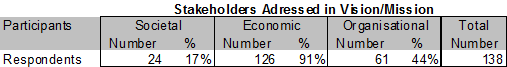
Non respondents: 16
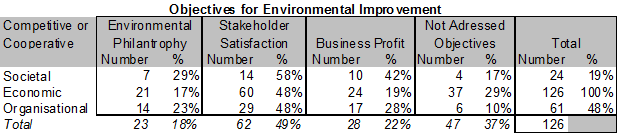
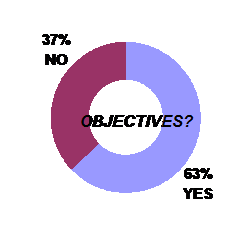
47 respondents (37%) responded they had no objectives for environmental improvements.
The highest scoring environmental objective was to secure satisfaction among all stakeholders (49%) while securing the business profitability (22%) and owners’ special interest (environmental philanthropy) in the environment (18%) accounted for the lowest number of selections.
Q6 multi choice / Q7 multi choice
Non respondents: 28
Out of the 24 respondents that addressed societal stakeholders in vision 42% selected company profitability objectives.
81% of respondents addressing economic stakeholders in vision, and 72% of respondents addressing organisational stakeholders in vision, did not select business profitability in environmental objectives.
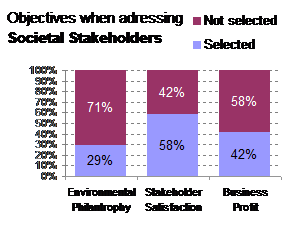
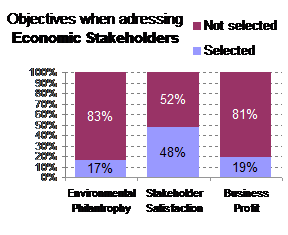
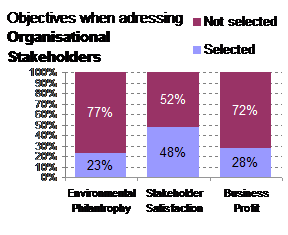
Vision, mission and objectives seem more adapted to the economic stakeholders (figure 7) with objectives of achieving stakeholder satisfaction above business profit.
The six research questions that test research hypothesis 1 forms the sub-chapter points below.
5.2.1 Competitive Attractiveness
1 a) Do differences in industry competitive attractiveness strongly influence stakeholder focus?
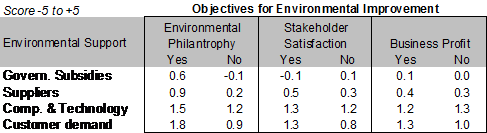
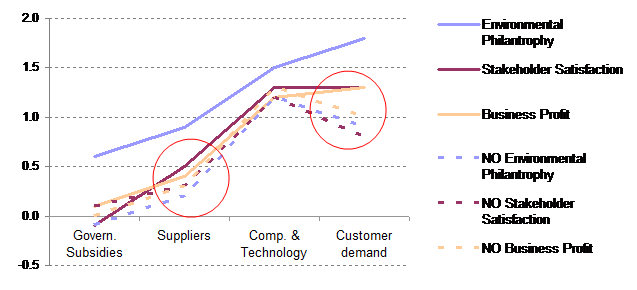
The interdependence between competitive attractiveness and objectives in environmental improvements when addressing stakeholders was analysed based on the data collected (scoring from -5 to +5) in the questionnaire and illustrated below.
Competence and technology in the industry scored the most positive (1.3) response. Customer demand the second (1.0) highest, while supplier support (0.4) and government support (0.2) scored the lowest.
Respondents stating they have objectives that are to secure owner’s special interest in environmental improvements (environmental philanthropy) were the most positive in evaluating the supporting factors in the industry.
Output data consistency was analysed by splitting up the analysis in respondents addressing stakeholders in strategic intent/objectives and those who did not.
A variance was determined regarding supplier support and the customer demand factors. The respondents not having objectives seemed to be more negative when scoring these two factors.
Q3 score / Q7 multi choice
Non respondents: 30
The interdependence indicated is that if pursuing objectives of a more phi-lanthropic nature, the support factors are perceived most favourable.
Further in depth analysis comparing position in the value network and the indu-stry’s support factors reveals that raw-material respondents score supplier support and customer demand lower than other value network groups.
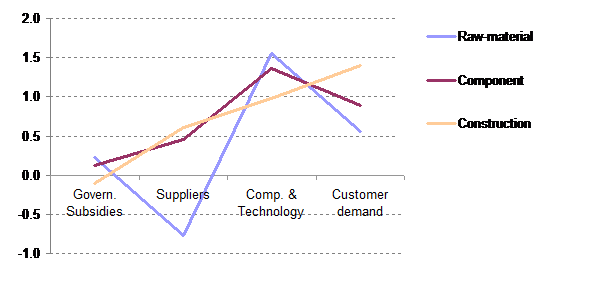
It appears that the more backwards in the value network respondents are positioned they perceive customer and supplier support to be lower.
5.2.2 Competitive or Cooperative Motives
1 b) Do competitive or cooperative motives strongly influence the strategic intent?
The interdependence between competitive or cooperative motives and objectives in environmental improvements when addressing stakeholders was analysed based on the data collected in the questionnaire and illustrated below.
Non respondents: 20
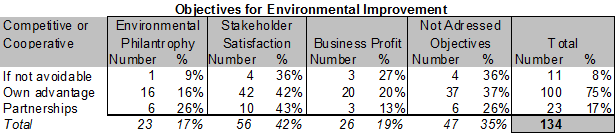
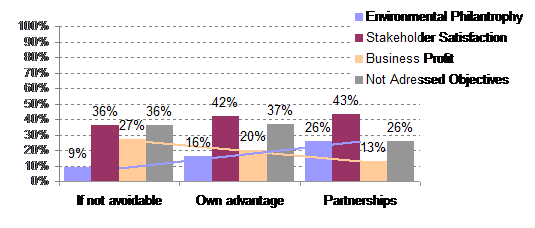
A 75% majority selected that their intention is to cooperate if it creates company advantage. Partnership cooperation accounted for 17% of responses and 8% selected that they cooperate if they can not avoid it.
Cooperative or competitive motives show relatedness towards objectives in more areas.
One apparent relationship is the tendency (linear) for business profit objectives to be less selected (13%) among respondents cooperating in partnerships compared to the respondents stating they cooperate if not able to avoid (27%).
A second relationship is the tendency (linear) for selecting partnership cooperation (26%) if holding objectives for special interest in the environment.
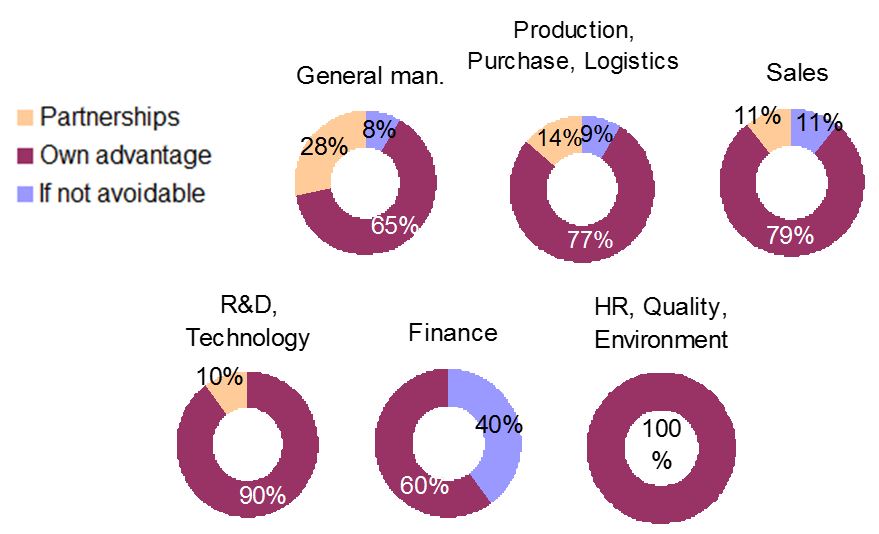
Respondents were at the end to state their functional position in the company. Relating this to the cooperative or competitive motives, general managers are the ones that select partnerships (28%) most often and respondents in finance and economics positions those who most often tend not to cooperate by sharing knowledge and resources.
The overall tendency is that strategic intent will be influenced by the ability to see the company benefits, but might be influenced by functional cultural attitudes.
The interdependence indicated is that cooperative motives influence strategic intent with a tendency of addressing business profit objectives if holding competitive motives, and addressing more philanthropic objectives if holding cooperative motives.